
A print ad that runs without its own response route leaves you guessing afterwards which placement brought the visits, enquiries or orders. The work happens before press: give each placement an address you can tell apart, and test that address on the printed proof.
To track a print ad, decide the one action you want readers to take, give every placement its own tagged destination, and test the route before the file goes to press. If your website uses Google Analytics 4 (GA4), UTM parameters on that destination let the Traffic acquisition report show sessions by source, medium and campaign. Those sessions are visits, not readers or sales: a QR scan is only counted if a redirect service logs it, and orders have to be checked in your order system. The tables below give you a register to fill in, a pre-press test and a way to read results without mixing those records.
Key points:
- You can track only the responses you planned and tagged; readers who never act leave no record.
- Give each placement, issue or creative version its own destination address.
- Test the printed QR code and the typed address on a fresh browser before approving the proof.
- Read scan logs, sessions, key events and orders as separate columns.
The opening image is an illustration; it does not show a real campaign, tracking tool or result.
What can you actually measure from a print ad?
You can measure actions that pass through a route you set up: a visit to a tagged web address, a form submitted on that page, an order placed with a code. Readership itself goes unrecorded: a distribution or circulation figure counts copies printed or handed out, not people who read your ad. Start by writing one statement for each ad that names the action, the route that carries it, the system that records it and the person responsible.
| Part of the statement | Example wording (hypothetical) | Why it matters |
|---|---|---|
| Action | “Request a sample pack” | One action gives you one number to compare across placements |
| Route | A short web address and a QR code printed on the ad, both leading to the same tagged page | The route decides which system can see the response |
| Recording system | The website’s analytics, plus the order or enquiry system for completed requests | Each system counts something different |
| Owner | The person who builds the link and checks the reports | Someone has to test the route and read the data |
This is the “Next step” line from the self-check list in our print advertising examples guide, written down so it can be measured.
Takeaway: If you cannot name the action and the system that records it, the ad is not ready to track.
Which records does each response route create?
Each step between the printed page and a completed order writes a different record, kept by a different system. Mixing them makes a print report look better or worse than the evidence allows, so keep them apart from the start.
| Record | Kept by | What it counts | What it does not tell you |
|---|---|---|---|
| Distribution or circulation figure | The publisher or mailing house, if they supply one | Copies printed, mailed or distributed, under their own definition | Who read the ad or acted on it |
| Scan or click log for a short link or QR redirect | The redirect or link service, only if you set one up | Requests to that address, under the service’s own rules for total and unique scans | Whether a session started or anyone bought |
| Analytics session with campaign values | Your web analytics, for example GA4 with UTM parameters | Sessions GA4 credits to those campaign values under its session attribution rules, which can include a later direct return visit; Google describes session and user metrics as estimates | Scans, tagged landings, people or orders |
| Key event | Your web analytics, after you mark an event as a key event | Times users triggered an action you chose as important, such as a form submission | Whether a lead became a customer |
| Verified order or enquiry | Your order, booking or CRM system | Completed business you can match to a code or source | Whether the ad caused it |
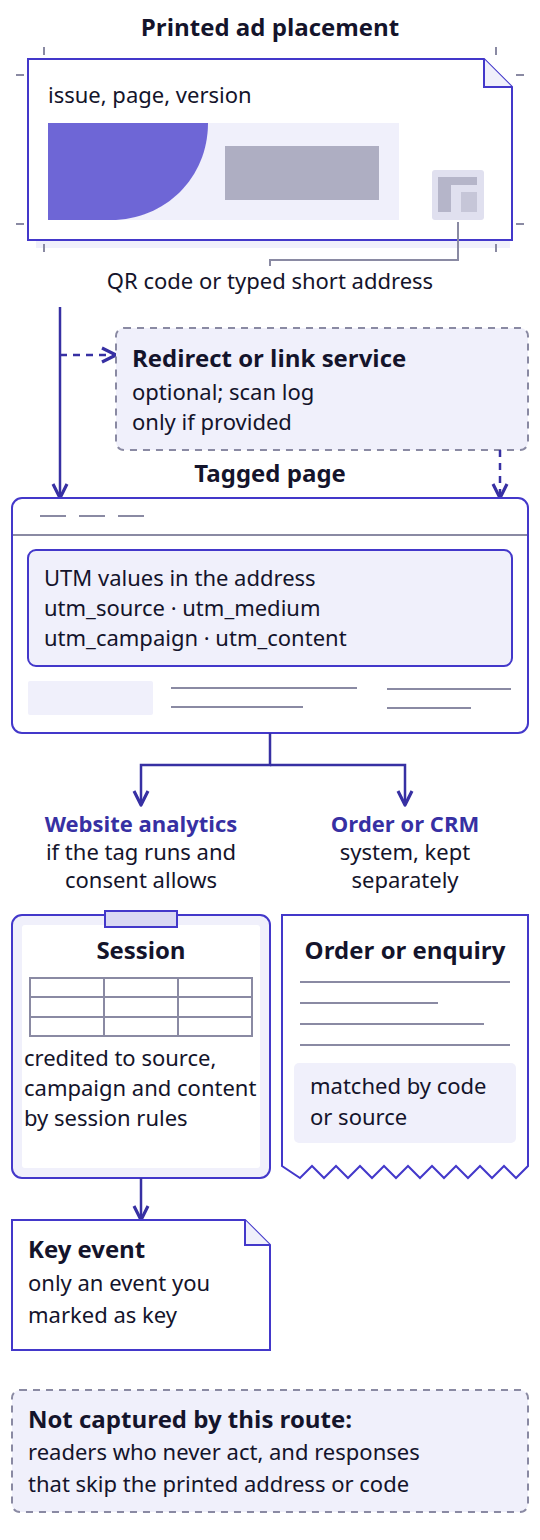
A QR code is a printed pattern that holds an address. It counts nothing by itself: scan numbers exist only when the code points to a redirect or link service that logs requests, and each service defines its own counts. If every printed piece carries a different code or address, as in personalised mailers, the variable-content brief in our Kodak PROSPER Plus 5 explainer covers how to agree the changing areas with the printer.
Takeaway: Label every number with the record it came from before comparing placements.
How should you name each placement?
Give each placement its own tagged destination URL and keep the names consistent. Google’s URL-builder help says to always include utm_source, utm_medium and utm_campaign, and to use utm_content to tell creatives apart. Values are case sensitive, so Spring and spring become two rows; Google recommends lowercase and one campaign name per marketing effort. If you set one UTM parameter, Google strongly recommends setting all the relevant ones, because missing values show up as “(not set)”.
The convention below is our suggestion for print, not a Google standard. Google lists “billboard” among its utm_source examples, but the default channel groups its Traffic acquisition help names (Direct, Organic Search, Paid Social, Organic Social and Email) do not include print. Check how your own property groups a print medium before you report by channel.
| Parameter | Suggested value for print | Example (hypothetical) |
|---|---|---|
utm_source |
The publication, venue or mailing list | citymag |
utm_medium |
One fixed word for all printed pieces | print |
utm_campaign |
The campaign name, identical on every piece | spring-sample |
utm_content |
Placement, issue and creative version | apr-issue-p12-v1 |
Keep a register with one row per placement, and fill it in before the artwork is final so the address printed on the ad matches its row.
| Register field | What to record |
|---|---|
| Placement ID | Publication or venue, issue or date, page or position |
| Creative version | Which layout or headline this placement uses |
| Printed short address | The exact address readers will type |
| QR destination | The address the QR code decodes to |
| Final tagged URL | The full destination with UTM parameters |
| Redirect owner | Who controls the short address and can change where it points |
| Test result | Date, device, the Page location seen and the event seen (next section) |
| Retest trigger | Who retests after the landing page, redirect or analytics setup changes |
A filled row, entirely hypothetical: placement “City Magazine, April issue, page 12, version 1”, short address example.com/spring, redirecting to https://example.com/samples/?utm_source=citymag&utm_medium=print&utm_campaign=spring-sample&utm_content=apr-issue-p12-v1. When the same ad runs in the May issue, give it a new utm_content value so the two issues stay apart. Keep customer names, email addresses and IDs out of printed URLs.
The short address also has to fit the layout and stay readable at the printed size. For multi-page pieces, our brochure software and file preparation guide covers the file side of placing it.
Takeaway: One placement, one register row, one tagged destination.
How do you test the route before the file goes to press?
Test each printed route on the proof: scan the QR code, type the short address and confirm that analytics records the tagged visit. Do it before you approve the proof, because nobody can correct a printed address afterwards. Use the table as a pass/fail sheet, and write “unknown” rather than “pass” for anything you could not check.
| Check | How to do it | Pass when |
|---|---|---|
| QR decodes to the register’s address | Scan the proof with two different phones | Both open the QR destination recorded in the register |
| Typed address works | Type the short address exactly as printed, on a phone and on a computer | It opens the same final page |
| Parameters reach the page | Read the final browser address after any redirects | All UTM values from the register are present and spelled the same |
| Fresh session | Use a new private window for each route, or a browser that has not visited the site recently | Each test visit starts its own new session |
| Analytics receives the visit | With debug mode on, watch GA4 DebugView or the Realtime report | The page view and the chosen key event appear |
| Campaign values recorded | Check Page location now; later, Traffic acquisition with Session manual ad content added | Source, medium and campaign match the register, and the utm_content value shows as its own row |
| Retest planned | Name who retests after any change | A date and an owner are in the register |

Google’s help pages explain why these checks are set up this way. GA4 leaves UTM parameters out of the “Landing page + query string” and “Page path + query string” dimensions and puts them in Page location, so a tag missing from a landing-page column has not necessarily been lost. A session starts when someone views a page while no session is active (by default a session times out after 30 minutes without activity), and the session_start event carries the UTM values. GA4 credits sessions by non-direct last click, so a later direct visit by the same user keeps the earlier source. That is why we suggest testing each route, QR code and typed address, in its own fresh browser session. DebugView works only with debug mode enabled, and events do not appear there if the site uses client-side privacy controls, or uses consent mode and the visitor has refused Analytics cookies. Google also recommends filtering out developer traffic, so your own test visits do not end up counted as campaign responses.
Common mistake: Reading an empty DebugView as proof that the route is broken, or that nobody responded. Check debug mode and consent settings first, and use the Acquisition reports for attribution; Google says Realtime and DebugView do only limited attribution analysis.
Run these checks alongside the production items in the self-check list for your own print ad, before the file goes to the printer.
Takeaway: A route is tested only when you have seen the tagged visit arrive in the report you will use.
How do you read the results after the ad runs?
Compare placements over the same date window and the same key event, and keep sessions, key events and orders in separate columns. In GA4, open Reports, then Acquisition, then Traffic acquisition, and look at Session source / medium or Session campaign. If the report is missing from the menu, an editor or administrator can add it back.
Those dimensions merge every placement that shares a source and campaign, such as the April and May issues in the example above. utm_content lands in the Session manual ad content dimension, so add that as a secondary dimension in Traffic acquisition, or build an exploration with Session campaign and Session manual ad content as rows. Each register row should then read as its own line; a row showing “(not set)” means the visits arrived without a utm_content value.
| Column | Where it comes from | How to read it |
|---|---|---|
| Sessions | Traffic acquisition, filtered to your print medium or campaign |
Sessions credited to the campaign, which can include later direct return visits; an estimate, not a count of people or scans |
| Placement and version | Session manual ad content, as a secondary dimension or in an exploration | Splits sessions and key events by the register’s utm_content value |
| Key events | Same report, Key events metric | How often the chosen action happened |
| Session key event rate | Same report | Sessions with a key event divided by all sessions; name the event when you quote it |
| Total revenue | Same report, only if purchase events send value and currency | Purchases, subscriptions and ad revenue minus refunds; not profit |
| Verified orders | Your order or CRM system, matched by code or source | Completed business you can check |
| Scan log | The redirect service, if you use one | Requests to the short address, under that service’s definition |
When the columns disagree, for example more requests in the redirect log than sessions in analytics, record both numbers and the likely reasons instead of adjusting one to match the other. Repeat scans by one person, refused analytics consent and scans that never finished loading the page can all open that gap.
Takeaway: Quote every number with its source and definition, and compare placements only on matching windows and events.
What tracking cannot tell you
Tracked responses show what happened on the routes you set up; they do not show what the ad caused. People who saw the ad may type your main address, search for your brand, phone, visit a shop or share the link. A typed or search visit shows your campaign values only if GA4 credits it to an earlier tagged visit by the same user, and calls or shop visits never reach analytics through this route. One person may scan twice, and one scan may never become a session. A tagged visit cannot show whether that person would have bought anyway.
Finding out whether the ad changed sales takes a different kind of test, for example running the ad in some comparable areas and not in others, then comparing results. Plan that with whoever owns your sales data before the campaign starts; this page gives no benchmarks or expected lift.
Takeaway: Report tracked responses as tracked responses, and treat the question of cause as a separate study.
When this does not apply
This guide covers response routes for printed ads that send readers to a website you control. If the ad file is still RGB and the printer has not named an output profile, settle who converts it in the CMYK vs RGB print handoff before you approve the proof. It does not cover ad platforms that tag their own links, privacy or consent law, QR code sizing or choosing a link service. GA4 is used as the example; other analytics tools name their reports differently. This site offers no tracking, design or printing services and has not run or tested any campaign; the tables are planning tools for your own work.
More print planning topics are in Print Design, and About explains how this independent site works.
Takeaway: Adapt the tables to your own tools, and confirm consent and data handling with the person responsible for them.
Method and sources
Platform statements come from six Google Analytics help pages read on October 11, 2026, covering manual tagging, URL builders, sessions, key events, DebugView and the Traffic acquisition report. The parameter convention, register, test sheet and example URL are editorial suggestions; the example uses the reserved example.com domain and describes no real campaign. No response rates, costs or results appear here because none were measured. Other guides are listed in the article index.
Takeaway: Read the Google statements as platform documentation and the tables as a template to adapt.
Related reading
- Print advertising examples: define the ad’s one idea and next step before you tag it.
- Kodak PROSPER Plus 5 brief: plan variable content when each printed piece carries its own code.
- Brochure software and cost: prepare the print file that carries the address.